Enhance your Alternative Data Strategy with Tip and Cue for Satellite Images

One could accuse me of buzz-word-packing in this title. But I reckon you’ve never heard of tip-and-cue — something I was reminded of at Explore 2020. If you’re interested in satellite images as an alternative data source, it’s worth understanding tip-and-cue and how it can advance your use case.
The tip-and-cue technique is used to identify possible issues within an area of interest at a low resolution (tip) and zoom in with higher resolution satellites tasked to a specific area (cue). By way of analogy, you’re interested in a book (your area of interest), a chapter name catches your eye (issue detected at low resolution), and then you go in for a detailed read (analysis at high resolution).
Satellite images as alternative data
Organisations have data. Lots of it.
Yes, there are issues with that data such as accessibility, centrality and duplication, but if you can navigate your organisation’s data well enough, you will hopefully find some features that are useful for business intelligence (BI) or machine learning (ML). But, what about data outside the organisation? I’m talking about — alternative data.
This term refers to a variety of publically and non-publically available data that an organisation generally does not have or use, but can scrape or purchase from sources such as website HTML, social media, fiscal reports, company reports, webcams, and on and on. Remote sensing data such as images taken from satellites or drones also fits into this definition of alternative data.
The availability of satellite images has changed over the last several years. For example, the number of satellites in orbit has increased, upping the number of revisits (e.g. instead of your city being imaged once a couple of weeks, it’s now imaged multiple times per day) along with high-resolution options and an increase in the availability of spectral bands. Also, the cost of acquiring high-resolution imagery is decreasing thanks to smaller satellites, reusable rockets, and the general evolution of the space industry from government to commercial functionality.
In short, the volume, velocity, variety, value, and veracity of satellite images has increased, making this data more accessible and potentially meaningful to a wider range of use cases.
This article is not going to get deeply technical. It’s going to focus on use cases. However, it is worth pointing out to my more technically inclined readers that the Python GIS stack also evolved too to meet the needs of data analysts and scientists leveraging remote sensing data. I mention that in this article and the video linked within — check it out if getting hands-on with Python and satellite images is more your thing than use cases.
Typical use cases
There are a number of use cases that satellite images enable. This article is not about the details but rather answer the question — why tip and cue? To answer that, it is worth having some context.
When identifying a use case that may leverage satellite images, ask these initial, basic questions. What doesn’t your current data tell you? Are there physical signs on earth that could close that ‘gap’ or give you more than what you currently have? What event or object might be a signal? How small is that event or object? Can frequencies within the electromagnetic spectrum aid in producing a relevant signal?
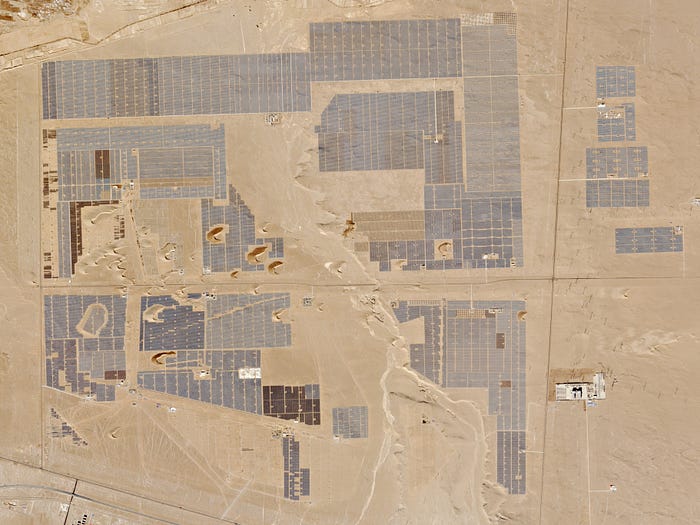
Object detection in this domain is very much achievable, and something done everyday now thanks to advancements in deep neural network architecture over the past several years along with the high frequency of high resolution satellite images. Things like oil storage facilities, wind turbines, well pad development, cars, buildings and lots more can be detected. For machine learning practitioners, this is probably not too surprising.
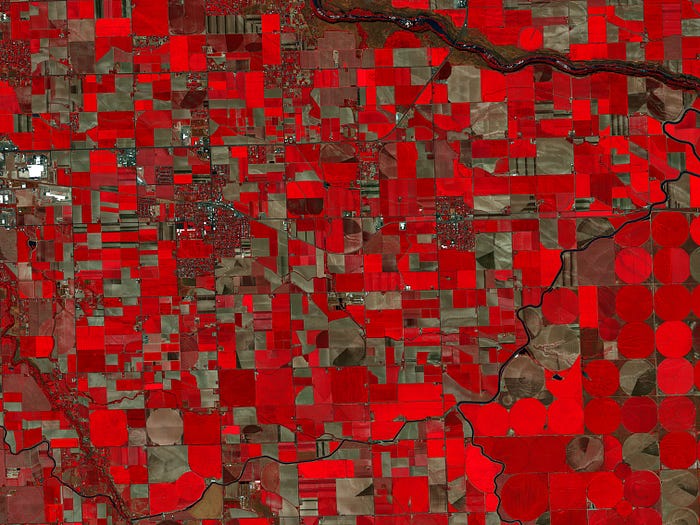
Spectral imaging is very relevant in this domain and may or may not intersect with object detection depending on the use case. This type of analysis aims to take visible and nonvisible bands of light and use them to identify phenomena like the growth of vegetation, even a specific type of plant. Spectral imaging is used to identify features in not only vegetation but also earth and water. Use cases range from deforestation detection, carbon calculation, urban forestry, mineral detection, flood warning, water quality and more. This really just touches the surface.
There are many use cases and likely many more are yet to be defined.
The impact of tip-and-cue on use cases
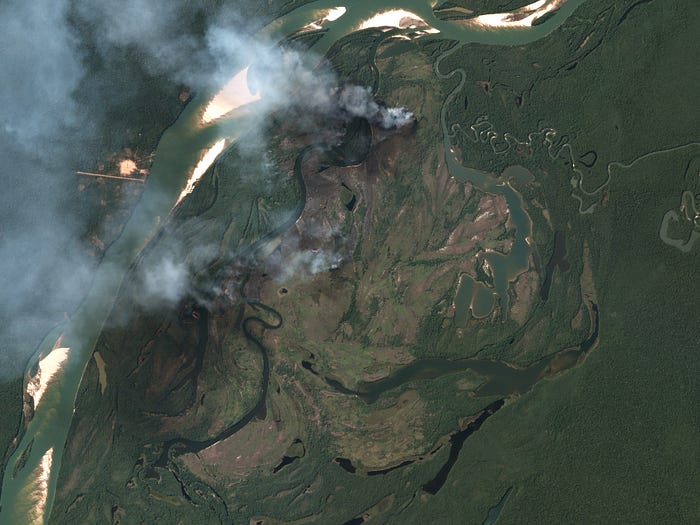
Take, for example, forestry management. A team tasked with this for a government agency or perhaps some kind of a utility might want to assess at scale the health of the forest it seeks to preserve.
With that in mind, something like NDVI or another vegetation index could be valuable in understanding the scale of carbon capture in their forest, growth rates of types of plants and generally the health of the environment.
Moreover, with the increased revisit rates of satellites, the temporal analysis could be used to more readily identify problematic events — such as a dramatic drop in NDVI along a river, possibly indicating erosion or another event. Alternatively, an increase in NDVI around crucial infrastructure, indicating a possible encroachment of vegetation that could be problematic.
These events could be used to ‘tip’ or notify the forestry management team of a potential issue. Once notified they can ‘cue’ or task a satellite to collect higher resolution images. This last step could be replaced by tasking a drone operator or onsight inspection instead, but if using satellite images only, the tip-and-cue process can be fully automated.
In this example, a higher resolution image could reveal objects or signals to shed more light on a potential risk in a way that may provide better, quicker and cheaper insights.
Finding the right use case
Remember tip-and-cue is one technique. It tends to lend itself towards very localised risk mitigation scenarios. It is not the only thing that can be done with satellite images.
With all of this in mind, you may still be wondering — what use case is relevant to me? It’s a good question and something you have to investigate and tease out. Alternative data can be useful, but it is alternative, meaning the use case may not be obvious.
If you’re not sure where to start, talking with a remote sensing specialist is useful but should also be coupled with a discovery phase that applies design thinking to the over-arching problem-solving process within your organisation.
Note, I reference Planet and others a lot in the links above. I’m not being paid by any provider to write this article — I’m just an enthusiastic data engineer/scientist and ultimately a big fan of this wonderful source of alternative data.